Tuesday, November 12, 2013

EURUSD Elliott Wave: Correction Up To 1.3500 Before Down

EURUSD reversed sharply to the downside in the last few days, clearly in five waves from above 1.3800 with a daily and weekly close price beneath the channel line connected from July lows. This break indicates a change in trend, and possible completion of a larger three wave rally in wave E. But as always we are focused on minimum expectations for the next few days and weeks, and that is a three wave decline from the top which is also expected on the alternate count which shows an incomplete wave E from 2012 low.

Written by www.ew-forecast.com

Hurry Up! Only a Few Hours Left for 2 for 1 Offer: Register Now & Save 50% >>> http://www.ew-forecast.com/register  [2 for 1:  Get 2 Month Package For Price of 1]

Monday, November 11, 2013

NZDUSD Is Looking Bearish Against 0.8415-Elliott Wave Analysis

The USD moved sharply to the upside on Friday after NFP report, but moves were not so significant against some majors. EUR/USD per example is still above 1.3290 low while AUDUSD and some other commodity currencies seems to be much weaker.

Today, we are looking at NZDUSD that seems to be bearish for wave E) to complete a weekly triangle. So if wave E) is going lower, then short term opportunities could be on lower time frames. On the 4h chart per example we see five waves down and three up to 0.9413 where rally looks completed after recent broken trend line that is now pointing for decline to a new low and possible even to 0.8100 in this week. Any taken shorts on this pair should have stops above 0.9400.


NZDUSD weekly
NZDUSD 4h
Hurry Up! Only a Few Hours Left for 2 for 1 Offer: Register Now & Save 50% >>> http://www.ew-forecast.com/register  [2 for 1 Get 2 Month Package For Price of 1]

Friday, November 8, 2013

USDJPY Could Fall Lower – Elliott Wave

USDJPY finally broke to the upside yesterday, above former swing high but rally has then stopped at 99.40 from where we have seen a sharp almost 200 pip fall. If we take a closer look now on whole rally from 96.55 then we can see that recovery has unfolded only in three legs which is bearish structure that is pointing now lower, back to 96.55, especially once lower support line of a corrective channel gives way.

USDJPY Elliott Wave 4h
Elliott Wave Education: Zig Zag Pattern
A zig-zag has a 3 sub-wave structure labeled A-B-C. Generally Zig Zag moves counter to the larger trend. Zig-zag is one of the most common corrective Elliott wave patterns.
        5-3-5 Sub-wave structure
        Wave A must be a motive wave
        Wave B can only be a corrective pattern
        Wave B must be shorter than wave A by price distance
        Wave C must be a motive wave.
        It appears in wave two or four in an impulse, wave B in an A-B-C, wave X in a double or triple zig-zag, or wave Y in a triple threes

Written by www.ew-forecast.com
Special Offer :: Get 2 Month Subscription For Payment of 1 Month

Wednesday, November 6, 2013

USDCHF Remains Bullish Within Impulsive Rise-Elliott Wave Forecast

USDCHF extended its gains in the last week, through 0.9044 swing and more importantly, it moved out of a recent upward channel. This breakout (blue circle) usually occurs in the middle of a wave three of a five wave rally, so if we respect the price action then pair is now forming an important bullish reversal from October lows. With that said, USDCHF is expected to stay in bullish mode, so current slow and sideways price action above 0.9090 is wave 4 of 3) which means that price is expected to rise up in wave 5 of 3) towarss 0.9180-0.9190.
Written by www.ew-forecast.com

Special Offer :: Get 2 Month Subscription For Payment of 1 Month
 50% Saving >>>  http://www.ew-forecast.com/register

Thursday, October 31, 2013

USDJPY: The Wave Structure Is Pointing Towards 99 And 100

USDJPY reversed nicely higher in this week, now already trading well above the upper trend line of a corrective channel connected from 99.00 swing high. This breakout is a confirmation for a change trend; from temporary bearish direction to bullish view. As such, we believe that corrective three wave decline in wave 2/B is complete at 96.92 and that prices are moving up in wave 3 or wave C. Both waves, C and 3 are motive waves which means that we expect a five wave rally from end of wave 2/B so pair is expected to revisit zone above 99, possibly even 100 psychological level. In the near-term however, we could see a pull-back to 97.90-98.10 region in wave (ii) before uptrend resumes.

Register For Our Free Webinar On Elliott Wave:


Wednesday, October 30, 2013

USDCHF Elliott Wave: Corrective Rally Could Stop At 0.9000-0.9045

USDCHF unexpectedly turned higher in this week back to 0.9000 level but still in the context of a larger bearish trend if we consider the latest structure. We see a five wave fall from above 0.9170 to 0.8888 so current upward reaction could be just a temporary bear market rally. Notice that current recovery is also approaching former wave 4 as well as to 38.2% and 50% retracement area that could react as a strong resistance zone. With that said, new sell-off on this pair may follow soon. Only rise and close above 0.9100 would put bullish price in action. Until then we are bearish.
USDCHF 4h

Written by www.ew-forecast.com  

Free Webinar on Elliott Wave

Elliott Wave Principle and Live Analysis WEBINAR, Reserve Your Seat Now For Free >>> Here

Tuesday, October 29, 2013

Intraday Elliott Wave Analysis For GOLD & E-mini S&P500

GOLD reversed through 1346 support so it seems that market reached a temporary high and that prices could stay sideways or move even lower in the next few days. We will keep an eye on minimum three waves down, but still need five sub-waves in wave (a) to confirm a bearish turning point back to 1329; termination point of fourth wave.
GOLD 1h
Our analysis on S&P Futures with a bullish view was on the spot lately, but now it may be time to consider a coming corrective reversal because price seems to be moving up in wave five. In fact, there was a triangle placed in wave four and we know that triangles occur prior to the final move of the larger pattern. If that is the case, then market is now in final part of current bullish trend so bearish reversal should not be a surprise. However, triangle measurement shows room for 1768/1770 before turning point occurs.
S&P Futures 1h
FREE WEBINAR by EW-Forecast.com
Elliott Wave Principle and Live Analysis WEBINAR, Reserve Your Seat Now For Free >>> Here 

Monday, October 28, 2013

EURUSD Bulls Could Extend Up to 1.3900 – Elliott Wave Analysis

EURUSD is bullish for the last few weeks with accelerating price action from 1.3470 so we suspect it represents a black wave 3 in progress that may extend even up to 1.3900 with five subwaves. Right now price could be slowing down in wave (iv), but only temporary as we will look for a push up in wave (v) in this week. Support for current pull-back comes in around 1.3760.
Offer: 7 Days Free Trial
Try EW-Forecast.com's Services Completely Free For 7 Days at http://www.ew-forecast.com/service  

Wednesday, October 23, 2013

E-mini S&P500; Support Seen At 1735-Elliott Wave Forecast

S&P Futures are trading nicely higher since prices turned sharply to the upside more than a week back after a break out of a downward channel that put impulsive price action in play. Impulses are five wave patterns which for now is still not the case, so we assume that market is in corrective wave (iv) pull-back to 1735 where price may find a support and turn up in to wave (v) towards 1770. At 1735 you will find a former wave four as well as 38.2% Fibonacci retracement area compared to wave (iii) where typical fourth waves will find a base.
Critical invalidation level stands at 1709, at wave (i) swing high, because we know that in impulsive trend price of wave (iv) must not trade into the territory of a wave (i) otherwise the wave count is wrong.


Written by www.ew-forecast.com | Try Ew-Forecast.com’s Services Free For 7 Days at http://www.ew-forecast.com/service

Wednesday, October 2, 2013

USDCAD: Three Waves Up Within Downtrend Is A Bearish Structure

USDCAD is recovering from 1.0180 but in corrective fashion labeled as wave (iv) that is part of a larger incomplete five wave decline  from August high. We can see that rally from 1.0180 is in three waves that retraced back to former wave four for 38.2%-50% retracement area. As such, thats an ideal zone for a reversal back to previous lows; 1.0280 break will confirm the bearish case for this market, while rise above 1.0450 will invalidate it.


Friday, September 27, 2013

Elliott Forecast For AUDUSD: Correction Could Be Near Completion

AUDUSD is in a bearish reversal mode since last Friday when market completed a five wave recovery at 0.9528. As such, the contra-trend reaction has unfolded in three waves which has been expected as this is the minimum substructure of a corrective movement. Notice that now we have three waves down, with wave C trading at the area of a previous fourth wave. We can also see a decreasing momentum in this wave C based on reading on the Force index indicator. With that in mind reversal higher may follow soon, but it will be confirmed only if price reverses back to 0.9456 level. Nice technical support for wave C comes in at 0.9280.

If you are interested in our analysis then you can try us absolutely FREE FOR 7 DAYS!


Thursday, September 26, 2013

German Dax: Temporary Correction Within Uptrend-Elliott Wave Forecast

German DAX futures are in bullish move since start of September, showing an impulsive price action. Impulse is a five wave pattern so we expect more upside as current decline from the highs appears to be a fourth wave, a temporary contra-trend movement. For now, we don't see a completed pull-back yet, but market could find a support around 8510-8570 region where we see an open gap. Those gaps could react as a reversal, in our case as a support in wave 4 for a reversal up into wave 5. Targets for wave 5 are around 8860 where we see a 200% extension of a previous decline from 0845 to 8090 in August.  
Basically those fourth waves are pull-backs that could represent an opportunity to join the larger trend. However, if you are looking for any set-ups after wave four retracement its important to know some rules of the Elliott Wave principle. One of the most important rule is that wave 4 must never retrace back to the area of a wave 1. In our case this comes in at 8279, so as long market is above this level bullish view remains valid. 
German DAX 4h Elliott Wave Analysis


Wednesday, September 25, 2013

USD Index: Rally Is Looking Corrective, Bearish Waves Could Resume Soon

The markets are still very slow and choppy in tight ranges, so our view remains unchanged. We think that FX pairs are forming just a corrective price action within larger trend against the USD.

On the USD index hourly chart below we see a three wave rally from 80.13 within two parallel trend lines which we think its a contra-trend move; a-b-c. Notice that in wave c we also have a wedge pattern which looks like an ending diagonal. Ending diagonals are reversal pattern, so if we are correct then USD Index should turn bearish. Decline is expected to accelerate after a break of lower support line and 80.48 swing low. 
USD Index 1h

Based on USD Index bearish outlook the majors are expected to rally, particularly EUR, GBP, and CHF.
On GBPUSD we see a potential low in place of a three wave decline from 1.6160 to 1.5952 where pair may have completed a wave c leg of a contra-trend movement. Based on the latest price action immediate rise to 1.6044 and ideally 1.6086 is expected while 1.5952 holds. 1.5950 level should represent a stop loss to any intra-day long set-ups.
GBPUSD 30min

Written by www.ew-forecast.com | Try EW-Forecast.com’s Services Free For 7 Days at http://www.ew-forecast.com/service 


Tuesday, September 24, 2013

Elliott Wave Forecast For EURUSD and USDCHF

The market has been very slow for the last few sessions, so we suspect that pairs are trapped in corrective price action that will send USD lower in the near-term, particularly against the EUR, GBP and CHF, while commodity currencies such as AUD and CAD could stay under pressure or maybe sideways while metals, oil and other commodities are weakening. 
Our focus is still on EURUSD where we see a three wave move from the top which we think its corrective wave (iv) that already tested 38.2% retracement area so uptrend could resume soon up in wave v).
EURUSD 1h 

USDCHF is also slow and sideways in 45 pip range which its personality of a corrective price action. As such, pause around 0.9100 area is most likely just another correction within a downtrend. We believe its wave iv) which will send prices down in wave v) towards 0.9050 in this week. The only question is from where weakness will resume; from current prices or from 0.9160 where it’s a 38.2% retracement area.
USDCHF 1h

Written by www.ew-forecast.com | Try EW-Forecast.com’s Services Free For 7 Days at http://www.ew-forecast.com/service 

Monday, September 23, 2013

EURUSD Could Move Above 1.3600-Elliott Wave Forecast

EURUSD closed above 1.3500 figure last week which suggests more upside in this week. The reason for bullish outlook in the short-term is a sharp rally from 1.3320 low which appears to be a third leg within a third based on the personality of the move. Recently a third leg has stopped in 1.3565 so we suspect that current contra-trend movement is wave iv) that could look for completion around the upper trendline of a base channel. Keep in mind that larger trend is up and that uptrend could resume soon into wave v) of (iii) towards 1.3620. This outlook remains valid as long as 1.3384 level is not breached.
EURUSD 4h Elliott Wave Analysis

Written by www.ew-forecast.com | Try EW-Forecast.com’s Services Free For 7 Days at http://www.ew-forecast.com/service 

Friday, September 20, 2013

USDJPY: Short-term Prices Are Back In Bullish Mode

USDJPY reversed sharply from 97.75 region in this week, which appears to be an impulsive price action that also took out the upper side of a downward channel. These are all important signs for a change in trend, even if just temporary. With that said, we will be looking for higher USDJPY in days ahead as long as 97.75 low of a complex correction is in place. Ideally market will continue higher back to 100.60 region in impulsive fashion.

If you are interested in our analysis then you can try us absolutely FREE FOR 7 DAYS!

Monday, September 16, 2013

Elliott Wave Review: EURUSD and USDJPY

Markets gapped against the USD on Sunday, away from Friday's close price. We can see higher prices on EURUSD, US bonds and also US stocks futures after Lawrence Summers withdrew from the contest to succeed Ben Bernanke as the next chairman of the Federal Reserve. We have also seen a gap down on Crude Oil Futures after the U.S. and Russia have agreed on a framework for Syria to destroy its chemical weapons stockpile by the middle of 2014, as by media on Saturday.

Below we can see a gap up on EURUSD, where we expected a move higher into wave C after recent correction in B wave. Keep in mind that gaps usually get filled and that we also have only a three wave rise from monthly lows so bearish reversal could follow in this week. Technical resistance comes in at 1.3380-1.3400.
EURUSD 1h Elliott Wave Analysis

While EURUSD and US Bonds gapped higher the USDJPY moved to the downside and finally reached levels around 98.50 that we highlighted several times last week. However we need five wave move in wave (c) for a valid and completed expanded flat correction. As such, we are not tracking an ending diagonal in wave (c) that may complete the pattern around 98.00 area with a sub.-wave v). We also see a 61.8% in that zone which could be very interesting for buyers. 
USDJPY 1h Elliott Wave Analysis

Written by www.ew-forecast.com | Try EW-Forecast.com’s Services Free For 7 Dayas at http://www.ew-forecast.com/service 


Friday, September 6, 2013

Elliott Wave Pre-NFP Review: EURUSD and USDCAD

Markets did not go far since yesterday’s US close, as speculators are sitting on their hands ahead of the US NFP report today at 12:30GMT. Expectations are 178K; if news will be better than this, let’s say around 200K, then be aware of a strong push higher on USD Index that will cause weaker majors. At the same time US bonds could extend the decline based on QE tapering because of good data. Markets however may not be ready for tapering just yet, there is a lot of risk involved especially in stocks, and as a result we could see a spike higher on US stocks futures on good number but then sharp bearish reversal on speculation for tapering.
On the other-hand, if data will be bad then stocks may not go far but EUR, GBP and others will find a bid, but only temporary, because our wave patterns are pointing for strong USD. Lets take a look at EURUSD and USDCAD
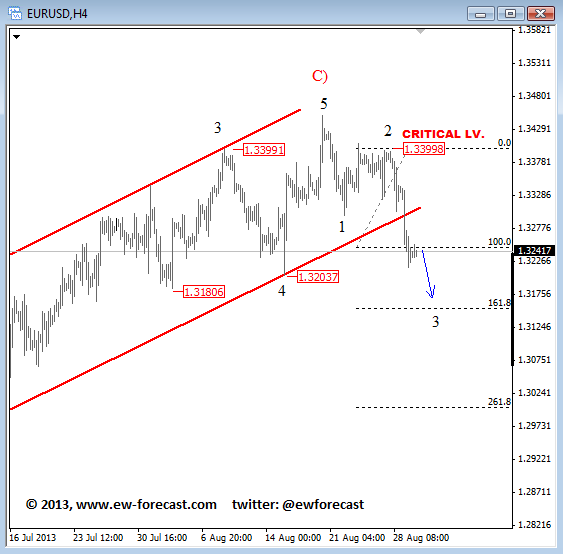
On EURUSD prices fell sharply yesterday from 1.3220 which could be start of a larger impulsive weakness. The reason is also a current bounce from 1.310 that has qualities of a corrective move. As such, bias remains bearish. Intra-day resistance is seen at 1.3150, at 38.2% Fibo level. Any rise back to 1.3220 will put pair in bullish mode, but only temporary for a larger corrective rally.
EURUSD 30min

On USDCAD we can see lower prices, but based on the wave structure since end of August we suspect that pair is in final stages of a corrective move, called a flat correction. Wave (c) already has five waves down, so be aware of a bounce. Break above 1.0515 wave (iv) point will suggest that flat is complete and bullish moves underway.
USDCAD 1h
Written by www.ew-forecast.com | Try Ew-Forecast.com's Services Free for 7 Days 

Wednesday, September 4, 2013

USDCHF Could Test 1.0000 By The End Of 2013 - Elliott Wave Forecast

USDCHF: Sharp reversal in 2011 from 0.7000 area is impulsive leg, and we know that impulses show direction of a current trend. As such, we think that pair is now bullish for minimum three wave rise; A)-B)-C). In the last few months we have seen a slow and choppy price action in 0.8900-1.0000 range which now seems to be a contracting triangle placed in wave B). We can already count five waves within this pattern so traders must be aware for a push higher into wave C) later this year.

USDCHF Weekly Elliott Wave Analysis
On Daily Chart contracting triangle is now in final stages. We are tracking a wave E that may be looking for a support around 0.9050-0.9200 zone. An impulsive bullish reversal in price back to 0.9700 will put USD in bullish mode against Swiss franc for a push above parity.
USDCHF Daily Elliott Wave Anaysis
 What is Triangle Elliott Wave Pattern?
A Triangle is a common 5 wave pattern which is labeled A-B-C-D-E.  Triangle moves counter-trend. It is corrective in nature. Triangles move within two channel lines drawn from waves A to C, and from waves B to D. A Triangle is either contracting or expanding depending on whether the channel lines are converging or expanding. Triangles are overlapping five wave affairs that subdivide 3-3-3-3-3.
Contracting Traingle:

  •         Structure is 3-3-3-3-3
  •         Each subwave of a triangle is usually a zig-zag
  •         Wave E must end in the price territory of wave A
  •         One subwave of a triangle usually has a much more complex structure than others subwaves
  •         Aappears in wave four in an impulse, wave B in an A-B-C, wave X or wave Y in a double threes, wave X or wave Z in a triple threes

EURUSD Could Bounce Back to 1.3220-1.3250 Before Downtrend Resumes

EURUSD is trading nicely lower for the last two weeks, which could be start of a new larger impulsive bearish trend. Notice that decline from 1.3400 is much larger compared to first leg down from 1.3450. Well, as we know third waves in the middle of a five wave decline are typical the longest, so we suspect that market is forming an impulsive decline, now with back wave 3 in progress that can extend even down to 1.3020 level while market trades beneath the upper trend line of a base channel. However, corrections and pull-backs will always occur, so don't be surprised by a retracement back to 1.3220-1.3250.

EURUSD 4h Elliott Wave Analysis

Written by www.ew-forecast.com | Try EW-Forecast.com’s Services Free for 7 Days at http://www.ew-forecast.com/service 


Tuesday, September 3, 2013

EURUSD Could Be Forming A Major Turning Point For The Year-Elliott Wave Analysis

EURUSD is trading nicely lower for the last week or so which could be start of a new larger impulsive bearish trend. However, decline from 1.3450 is actually still in three waves so corrective outlook must not be ignored but we will stay with current sentiment and focus on the bearish scenario as long as 1.3400 holds. Ideally market is now in the middle of an impulsive wave 3, and broken support channel line (blue circled zone on 4h chart) is important evidence for this count, because this breakout usually causes an acceleration that makes wave three the longest and sharpest wave. Downside projections for wave 3 are at 1.3130 and 1.3040.
EURUSD 4h Elliott Wave Analysis

On a daily chart we can see that EURUSD has been in uptrend mode almost all summer from 1.2750, but recovery has a corrective look. With that said, we think that move is complex correction, probably a flat and that larger trend will continue lower, especially if we consider a five wave decline from 1.3700 at the start of the year. Keep in mind that impulses show direction of a larger trend, which in our case it means down. If we are correct then latest bullish leg represents wave C) of a three wave pull-back that is already showing some evidences of a top at 1.3450. We however still need a larger impulsive weakness towards 1.3000 to confirm the end point of wave (2). If pair can do that, then EURUSD will be ready for a sharp fall in the rest of the year, probably to 1.2500 if not lower.
EURUSD Daily Elliott Wave Analysis 

On a weekly chart we are also tracking a huge head and shoulder pattern where right shoulder could already be finished, so weakness is expected towards the neckline. 
EURUSD Weekly Head & Shoulder Pattern 

Written by www.ew-forecast.com | Try EW-Forecast.com’s Services Free for 7 Days


Monday, September 2, 2013

E-mini S&P Can Retrace Back to 1667 Before Downtrend Resumes-Elliott Wave Analysis

S&P has been trading sharply lower last week but now showing some evidences of a low around 1625 area which is fine because we already have five needed sub-waves down in wave (A). We know that after every five wave move correction is expected, so recovery or sideways price action in this week should not be a surprise. We are talking about blue wave (B) that could already be underway and may even reach 1667 area before the Friday's US NFP. After wave (B) pull-back we will be looking for a strong sell-off in wave (C), into a third leg of decline.

S&P 500 4h Elliott Wave Analysis
The important thing that we need to understand now is a five wave of decline from 1705, which means that bearish reversal on stocks is confirmed and that prices will stay in bearish mode for few more weeks, and that any bounce will be temporary and limited with 1705. 

Friday, August 30, 2013

EURUSD: Bearish Waves Moving Toward 1.3200-1.3150-Elliott Wave Analysis

EURUSD is finally trading lower, clearly in impulsive fashion from 1.3400 which is a third leg of decline, but ideally it represents an impulsive wave 3 of a larger five wave move. Notice that price also broke and closed beneath the rising trend-line of an ending diagonal which is another and very important sign of a changed trend, from bullish to bearish mode. If we are correct, then pair is now heading down to 1.3150 in the near term.

EURUSD 4h chart Elliott Wave Analysis
If you are interested in EW-Forecast.com's analysis then you can try it absolutely FREE FOR 7 DAYS! 
Visit  http://www.ew-forecast.com/service/ for more details 

Thursday, August 29, 2013

Elliott Wave Forecast For USDCAD: Price Could Extend Up To 1.0650

On USDCAD we are tracking an impulsive price action from around 1.0280 which is still incomplete as we need five waves to the upside. In fact, in this week we have seen only a three wave set-back from the latest swing high which is a corrective structure, so we think that larger uptrend will resume soon so we labeled current retracement as wave 4, which means that we expect another push higher, into wave 5 that will be targeting 1.0620/1.0650. This bullish leg could start soon if we consider that pair already reached a very typical 38.2% retracement area for fourth waves.

USDCAD 4h Elliott Wave Analysis
Written by www.ew-forecast.com
Try EW-Forecast.com’s Services Free for 7 Days

Wednesday, August 28, 2013

Elliott Wave Analysis: Gold and Oil Are Ready For A Pull-back

We know that after every five wave move correction follow in three waves. And that’s exactly what is happening on OIL; we see a completed five wave move from 105.50 to 112.20 so market is now forming a pull-back; an a)-b)-c) move back to former wave four zone placed at 108.57.

OIL 1h Elliott Wave Analysis
 On GOLD we can see that prices reached 1430 level which was highlighted yesterday in our members area. From where we can already see some bearish pressure coming in, so market could form a temporary top very soon if we consider  five wave move up in black wave iii , which means that a corrective set-back in wave iv towards 1406 of former wave four could be in the cards. However, larger trend remains up so keep an eye on that 1406 figure for a possible bounce.
GOLD 1h Elliott Wave Analysis
 Written by www.ew-forecast.com
Try EW-Forecast.com's Services Free for 7 Days 

Tuesday, August 27, 2013

GOLD: Five waves Up Suggest A Corrective Retracement-Elliott Wave

Gold broke to a new high on Friday as expected after recent sideways price action above 1350 area, which was a fourth wave so now market is in wave five, final leg of an impulsive move which means that reversal in price may follow in this week. Why? Because as Elliott Wave theory says, after every five waves correction will follow. In fact, 1400 is also a very important and strong resistance area so a turning point or new consolidation should not be a surprise. If current trend will extend higher within wave (v) then next resistance zone is at 1420.

GOLD 4h – Elliott Wave Analysis
Elliott Wave Basic Pattern 
Written by www.ew-forecast.com | Try EW-Forecast.com's Services Free for 7 Days

Monday, August 26, 2013

Elliott Wave Analysis: Tracking USD Long Set-Ups While EUR Is Below 1.3450 and USDCHF above 0.9145

We can see some USD strength at the start of this European morning coming back into the market which has been expected based on the latest intraday price action. We were looking for a three wave move down on USDCHF with our members, and so far we can see that pair found a bottom nicely around 0.9190 from where we can see some encouraging upside reaction. Looks like we could be heading back to 0.9290, and possibly 0.9330 this week.
If you are interested in our analysis then you can try us absolutely FREE FOR 7 DAYS!
Visit  http://www.ew-forecast.com/service/ for more details

USDCHF 1h
EURUSD also now reversing from our »do or die« level placed at 1.3400, but still need a channel break and impulsive structure (five waves down) from above 1.3400 to make sure we are going lower.
EURUSD 1h
For now we are sitting on our hands, no official trades, but we are watching USDCHF, EURUSD and AUDUSD very closely for possible USD long set-ups. But at the moment however, I think it’s too soon for trades, it’s still only Monday and also holiday in the UK, so I believe it’s better to wait on more price action and see it then if USD rally has already began or no, and then go with the flow.
If you are interested in our analysis then you can try us absolutely FREE FOR 7 DAYS!
Visit  http://www.ew-forecast.com/service/ for more details

Friday, August 23, 2013

GOLD: Sideways Within Larger Uptrend: Elliott Wave Analysis

On Gold we are tracking a bullish continuation from 1272 that should be in five waves, because we are tracking wave C/3 which are both motive waves. Right now we can see only three completed legs, but current sideways price action seems like a fourth wave, so be aware of another rise in the near future, up to 1390-1400 zone.

Only a decisive fall through 1344 support and towards 1318 level will suggest that bearish reversal is unfolding. In such case we would focus on daily alternate count.

GOLD 4h – Elliott Wave Analysis

Wednesday, August 21, 2013

Elliott Wave Analysis: USDJPY Is Showing a Bullish Structure

USDJPY has made three waves of a pull-back from latest high that could be near completion as price tested and already reversed from very important 61.8% Fibonacci support level. We expect to see a move higher from here, ideally in impulsive fashion back to 98.64.
 The reason for a bullish outlook is previous five wave rally in wave A) which is called an impulsive move.  Impulses show direction of a trend or temporary change in trend, that’s why we think that current trend is bullish, and that three wave retracement from 98.65 is temporary. Invalidation level remains at 95.75.
On the basic chart below you can see where USDJPY is at the moment.
 Written by www.ew-forecast.com 

Tuesday, August 20, 2013

OIL: Corrective Pause Appears Complete; 110 Back in View-Elliott Wave Analysis

OIL is trading slightly lower after recent reversal from the upper channel resistance line shown on the 4-hourly chart. However, we cannot ignore a three wave decline from July high which is clearly a contra-trend movement, called a zig-zag in Elliott Wave theory. With that in mind, we will continue to look for higher prices on crude oil as long as 102.15 support is in place. As such, we suspect that current set-back is wave (ii) that may look for a support in 104-105 zone, in one of the Fibonacci support levels. Reversal from there, in impulsive fashion back to 108 will be nice indication for a bullish moves, but then towards 110 level.

OIL 4h chart
On a daily chart of oil we can see that price broke sharply higher few weeks back, which is looking impulsive; its sharp move in the short period of time. Impulses are five wave patterns and if we focus just on latest rally from 91.20 we can see that move is not in five waves yet. As such, we think that latest pull-back from above 109 was wave four so we are looking higher into wave 5.
Oil Daily chart
Written by www.ew-forecast.com | Try ew-forecast.com's services free for 7 days

USD Index: Forming A Complex Correction – Elliott Wave Analysis

USD Index is trading lower for few weeks now but decline from 85.00 has a corrective look for now so we suspect its part of a larger complex correction from May highs. We are tracking a W)-X)-Y) correction, so if we are correct the USD should find a support somewhere around 80.30-81.00 level. An impulsive rally from here and back to 83.00 will put prices back in bullish mode. That's what is called a confirming price action. Let's see if we get one!
If you are interested in our analysis then you can try us absolutely FREE FOR 7 DAYS!

Visit  http://www.ew-forecast.com/service/ for more details

Monday, August 19, 2013

USDJPY Sideways On Daily But Bullish On Intra-day Time Frame

USDJPY found a support last week around 95-96 level as expected from where sharp rally suggests that market accomplished wave C) of a triangle and that price is now moving higher in wave D), still only fourth leg within complex correction. But we need 5 of them, so be aware of more choppy and overlapping price action in 95.80-101.50 range in days ahead before market breaks to the upside. However in the near-term price could reach levels around 99.00 before three wave rise in wave D) is complete. Support for current black sub-wave B comes in around 96.80.

USDJPY Daily-Elliott Wave Analysis Chart
However in the near-term price could reach levels around 99.00 before three wave rise in wave D) is complete. Support for current black sub-wave B comes in around 96.80 where traders with bullish bias could be interested in long opportunities. In that zone we can see a 61.8% retracement area compared to previous five wave rally; that’s an ideal Fibonacci reversal zone for B-waves.
USDJPY 4h-Elliott Wave Analysis Chart
Written by www.ew-forecast.com | Try our services free for 7 days