Friday, June 28, 2013

Elliott Wave Intra-day Review: EURUSD, USDJPY and NIKKEI225

In yesterdays intra-day video (for members) we were talking about possible larger pull-back on the EURUSD up in wave 2. Well, we can see a push above hourly resistance line of an EW channel which suggests higher prices or maybe sideways move if correction will be smaller in price, but longer in time. But in either case we think that move from below 1.3000 is corrective and that sooner or later downtrend will resume. Ideal resistance zone for current bounce is at 1.3150-1.3200.

During Asian session we have seen higher Nikkei futures that caused a push higher on USDJPY pair. Prices are now approaching 99.00 level but based on the updated chart we see room for 100 psycho level, especially if we also consider that we need five waves within wave C from 97.00. So for now USDJPY remains in uptrend but we expect a bearish reversal in the next few trading days, probably early next week.

Nikkei and USDJPY has normally positive correlation so if USDJPY will turn bearish, Nikkei will probably follow. In fact, on Nikkie we see a three wave rise from June low, now wave wave C approaching resistance around 14000.

Do you like our analysis? You want more? Now it’s your time, get our services now for 2 Months for Price of 1.


Thursday, June 27, 2013

USD Index: Resistance At 83.00 May Cause A Temporary Pull-back

USD Index is at its high of the week, probably at the end of a black wave A/1 because we can count five sub-waves from 80.50. Notice that on the RSI we also have a bearish divergence which is also very important sing for a potential top in the near-future. However, for now trend is still up so we favour stronger USD; meanwhile any pull-back lower will be corrective wave, part of a larger uptrend. In such case three wave retracement will be a long opportunity.

USD Index 4h
Do you like our analysis? You want more? Now it’s your time, get our services now for 2 Months for Price of 1.

USDCAD: Correction Within Uptrend; Can We See 1.0600?!

USDCAD is in a pull-back mode from latest high which we think its just another correction within larger incomplete uptrend. We are tracking an impulsive structure from 1.0134 that needs to be made by five smaller waves. For now that’s not the case so we think that current bearish reversal represents a corrective wave 4 that will look for a support around 1.0400-1.0430 region where previous broken high may become a good support. At the same zone we can also see a very typical 382.% Fibonacci retracement level from where we definitely expect to see a bounce. So for now pair remains in uptrend as long as 1.0240 is in place, but push beneath 61.8% retracement would already threaten the bullish view.
Do you like our analysis? You want more? Now it’s your time, get our services now for 2 Months for Price of 1.


Wednesday, June 26, 2013

S&P500 Is Testing Important Resistance at 1600-1610-New Sell-Off To Come?

US stocks were trading higher in pre-market session today so the S&P500 cash market is higher now, testing very important levels back from June 6th and 13th. That’s ideal zone for a new sell-off, so traders must be aware of a decline back to 1560 especially if 1582 gives way. If stocks will reverse lower then AUDUSD may follow based on the latest correlation.
S&P500 1h

E_mini S&P vs. AUDUSD
Do you like our analysis? You want more? Now it’s your time, get our services now for 2 Months for Price of 1.

GBPUSD Is Bearish Against 1.5750

GBPUSD is reversing from 1.5340 which appears to be start of a larger recovery, but only temporary. Notice that first leg down from 1.5750 has unfolded in five waves which means that move is impulsive and showing direction of a current trend that is bearish. As such, we expect that this trend will continue but after a completed three wave rise in black wave 2 that is now unfolding. Ideally this pull-back will find resistance somewhere around 1.5530/1.5600.


Do you like our analysis? You want more? Now it's your time, get our services now for 2 Months for Price of 1.
Click here for 2 FOR 1 offer

Tuesday, June 25, 2013

GOLD Is Impulsive; Could See New Sell-off From Around 1310

GOLD fell sharply lower last week, even through 1300 psychological level. Decline is looking impulsive, which means that move should be made by five smaller waves before bearish trend can find the low. At the moment we can see some reversal to the upside, but we think that’s only wave four that will be looking for resistance area around base channel  and at 38.2% Fibonacci level area; close to 1310.
Follow Through On Strategy for Gold since June 10 2013
In fact we shared also free article at the time; Click here
Do you like our analysis? You want more? Now Its your time, get our services now for 2 Months for Price of 1.

Elliott Wave Count For USDJPY: Recovery Could Extend Up To 100 Level

USDJPY  is trading higher since FOMC statement on Wednesday. Pair broke above the upper trend-line of Elliott Wave channel so we think five waves down in wave A)/1) is complete and that market is in first leg of a minimum three wave corrective rally. We are talking about wave B)/2) that may reach 100 area later this week. Right now we see five waves up from 93.78 so we think that wave A is near completion, so be aware of a wave B pull-back in the near future.
SPECIAL OFFER

Monday, June 24, 2013

EURUSD: You Must See These Charts!!

Traders, please check our next video on EURUSD and why we think that pair could fell much lower in the next few days and even weeks.

SPECIAL OFFER: 2 Month Membership for Price of 1


EURUSD: Bearish Reversal In Progress-More Weakness In View

On EURUSD we can count three waves up from 1.2750 low which we believe it represents a corrective, contra-trend price action within a larger downtrend. We are talking about blue wave (2) which is now showing signs of completion around 1.3420 level after sharp decline last week which is impulsive move. As such, we expect further weakness in coming days and weeks, ideally back to April low.
EURUS Daily

Friday, June 21, 2013

S&P Futures are higher today

S&P Futures are higher today and still in the middle of a three wave rally. Watch for new possible new sell-off from around 1610 region.

USDCAD: Bullish Waves May Lift Prices To 1.0500-Elliott Wave Forecast

USDCAD reversed nicely higher from 1.0134 low where double zig-zag appears complete. The reason is sharp rise in the last two trading days which clearly has personality of wave 3 of a new five wave rally. The next important thing for bullish continuation is a broken trend-line connected from latest high. As such, we think pair is headed higher, ideally towards 1.0500 while 1.0240 level must not be breached. Why 1.0240? Because we know that when black wave 4 pull-back will occur, prices must not retrace into a territory of a wave 1.


Thursday, June 20, 2013

Lower Stock Market Is Pushing The USD Higher Against The Majors-Elliott Wave

European stock market is sharply lower today following yesterday sell-off on US equities after Ben Bernanke who said yesterday that if the economy continues to improve, it could start to wind down its $85 billion a month asset-purchasing program towards the end of 2013 and end it in 2014.
Metals are moving sharply lower, with gold testing now psychological level at $1300 and silver $20. We could see some technical bounce from here especially if we also consider Elliott Wave pattern which suggests that price is at the end of wave iii), now testing 261.8% Fibonacci support.  As I know a lot of our clients were shorting gold since June 10. If you are one of them, then I suggest you to close some % and make very tight stops.
GOLD 1h

E-mini S&P500 is also looking weak since yesterday where we can count now five waves down from latest high. This is impulse that confirms the change in trend; from bullish to bearish mode.
E-mini S&P500 1h

EURUSD also extended its decline in the last hour or so, which means that correlation between EURUSD and stocks are normal for now. USD is safe-haven in risk-off mode so normally traders will be interested in Long USD opportunities.

Market Correlations 1h 

Wednesday, June 19, 2013

Elliott Wave Review: EURUSD, USD Index and E-mini S&P500

EURUSD and S&P are higher in this week, but generally speaking markets are slow and sideways ahead of FOMC later today. On EURUSD we are tracking an ending diagonal in fifth wave but as long as we have higher highs and higher lows in place trend remains up with possible test of 1.3450 in the near future.
EURUSD 1h

The reason why we think that EUR can reach higher levels is the following USD index chart where price is still above its lows from last week. Notice that we are observing a triangle here with wave (e) in view, before we see break lower that should support the EURUSD. Critical level on USD Index is around 81.00; market is bearish below it.
USD Index 1h

E-mini S&P500 were higher in the last few sessions and successfully moved through 1647 that we highlighted it several times in our past updates. We still believe that market is making a wave (c) rally from 1596, so we need to be aware of a reversal lower from 1655/1660 region.
S&P Futures 1h

Tuesday, June 18, 2013

OIL Prices Could Reach $100 In The Next Few Days- Elliott Wave Forecast


OIL moved nicely higher last week and closed above 97.00 key level which means that bullish trend is probably confirmed if we consider that three wave retracement from early May high appears complete. If we are correct then rally from 91.20 should unfold impulsive. With that in mind, we expect further strength on oil as we need five waves up from 91.20. Right now we see prices in the middle of a black wave 3 that may be targeting 99.30/100 area this week while market trades above 96.40. 

Oil 4h 


GBPUSD May Reverse Into A Deeper Pull-back, towards 1.5480


On cable we can count five waves up in wave A) from 1.5000 psychological level which means that temporary high for this pair could be near if we consider that after every five waves correction follows. With that said, a coming corrective retracement would be red wave B) that is part of an incomplete second zig-zag in wave II. If we get lower levels for wave B) then watch for a bounce/support zone at 1.5480/1.5550.


Monday, June 17, 2013

EURUSD: Sideways Within Uptrend


EURUSD is slow, choppy and sideways for the last few trading days which we believe it represents a corrective price action within a larger uptrend. We are talking about wave 4 which still could retrace deeper if we consider wave four support of one lesser degree is at 1.3176. After a completion of that black wave 4 traders must be aware of another push higher, into wave 5 of C that may complete rally somewhere between 1.3400-1.3500 region.


Friday, June 7, 2013

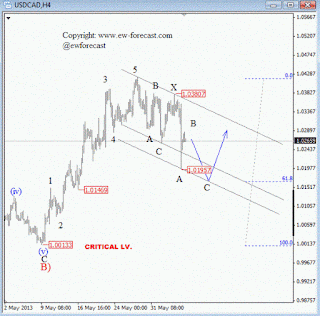
Elliott Wave Forecast for USDCAD: Corrective pull-back going complex

USDCAD unexpectedly moved lower yesterday, but still in sharp of a corrective movement, but more complex than on the first place. We are now observing a double zig-zag in progress which could find a bottom then around 1.0150/1.0180, close to 61.8% retracement area. From a larger perspective, trend remains bullish as long as 1.0013 is in place.

For more analysis visit us at http://www.ew-forecast.com/

Thursday, June 6, 2013

Intra-day Elliott Waves: S&P Futures At New Low After Draghi Speech

S&P Futures just broke to a new low on Draghi speech, so it seems this market is headed now beneath 1600 as current decline in wave three or wave c is incomplete. In any case we will be tracking an impulsive, five waves down so more weakness is expected while market is trading beneath 1621. Coming bounce should be corrective wave four, before downtrend resumes.

S&P Futures count #1- wave b triangle, now wave c down
S&P Futures count #2- wave three in progress of a larger bearish impulsive decline
For more analysis visit us at http://www.ew-forecast.com/

Tuesday, June 4, 2013

OIL Is Trapped In A Triangle Pattern That Suggests Higher Prices Later This Year

Oil is slow, choppy and overlapping since September 2012 , so we think that whole price action represents a triangle pattern in red wave B) that is part of three wave rally in wave (D) from June 2012 low. If we are correct, then we know that we need five sub-waves within a triangle before we may look for a push higher into C) of (D) towards 102/103 mark. Well, current reversal from around 97.00, trend-line resistance region seems to be a wave E pull-back, final leg in a triangle pattern. As such, triangle could be near completion, but based on Fibonacci levels we see room for even deeper pull-back, towards 88.00 area before market may turn bullish again, but it should sometime this year.
WHAT IS A TRIANGLE-?

A Triangle is a common 5 wave pattern labeled A-B-C-D-E that moves counter-trend and is corrective in nature. Triangles move within two channel lines drawn from waves A to C, and from waves B to D. A Triangle is either contracting or expanding depending on whether the channel lines are converging or expanding. Triangles are overlapping five wave affairs that subdivide 3-3-3-3-3.

For more analysis visit us at http://www.ew-forecast.com/