Friday, August 30, 2013

EURUSD: Bearish Waves Moving Toward 1.3200-1.3150-Elliott Wave Analysis

EURUSD is finally trading lower, clearly in impulsive fashion from 1.3400 which is a third leg of decline, but ideally it represents an impulsive wave 3 of a larger five wave move. Notice that price also broke and closed beneath the rising trend-line of an ending diagonal which is another and very important sign of a changed trend, from bullish to bearish mode. If we are correct, then pair is now heading down to 1.3150 in the near term.

EURUSD 4h chart Elliott Wave Analysis
If you are interested in EW-Forecast.com's analysis then you can try it absolutely FREE FOR 7 DAYS! 
Visit  http://www.ew-forecast.com/service/ for more details 

Thursday, August 29, 2013

Elliott Wave Forecast For USDCAD: Price Could Extend Up To 1.0650

On USDCAD we are tracking an impulsive price action from around 1.0280 which is still incomplete as we need five waves to the upside. In fact, in this week we have seen only a three wave set-back from the latest swing high which is a corrective structure, so we think that larger uptrend will resume soon so we labeled current retracement as wave 4, which means that we expect another push higher, into wave 5 that will be targeting 1.0620/1.0650. This bullish leg could start soon if we consider that pair already reached a very typical 38.2% retracement area for fourth waves.

USDCAD 4h Elliott Wave Analysis
Written by www.ew-forecast.com
Try EW-Forecast.com’s Services Free for 7 Days

Wednesday, August 28, 2013

Elliott Wave Analysis: Gold and Oil Are Ready For A Pull-back

We know that after every five wave move correction follow in three waves. And that’s exactly what is happening on OIL; we see a completed five wave move from 105.50 to 112.20 so market is now forming a pull-back; an a)-b)-c) move back to former wave four zone placed at 108.57.

OIL 1h Elliott Wave Analysis
 On GOLD we can see that prices reached 1430 level which was highlighted yesterday in our members area. From where we can already see some bearish pressure coming in, so market could form a temporary top very soon if we consider  five wave move up in black wave iii , which means that a corrective set-back in wave iv towards 1406 of former wave four could be in the cards. However, larger trend remains up so keep an eye on that 1406 figure for a possible bounce.
GOLD 1h Elliott Wave Analysis
 Written by www.ew-forecast.com
Try EW-Forecast.com's Services Free for 7 Days 

Tuesday, August 27, 2013

GOLD: Five waves Up Suggest A Corrective Retracement-Elliott Wave

Gold broke to a new high on Friday as expected after recent sideways price action above 1350 area, which was a fourth wave so now market is in wave five, final leg of an impulsive move which means that reversal in price may follow in this week. Why? Because as Elliott Wave theory says, after every five waves correction will follow. In fact, 1400 is also a very important and strong resistance area so a turning point or new consolidation should not be a surprise. If current trend will extend higher within wave (v) then next resistance zone is at 1420.

GOLD 4h – Elliott Wave Analysis
Elliott Wave Basic Pattern 
Written by www.ew-forecast.com | Try EW-Forecast.com's Services Free for 7 Days

Monday, August 26, 2013

Elliott Wave Analysis: Tracking USD Long Set-Ups While EUR Is Below 1.3450 and USDCHF above 0.9145

We can see some USD strength at the start of this European morning coming back into the market which has been expected based on the latest intraday price action. We were looking for a three wave move down on USDCHF with our members, and so far we can see that pair found a bottom nicely around 0.9190 from where we can see some encouraging upside reaction. Looks like we could be heading back to 0.9290, and possibly 0.9330 this week.
If you are interested in our analysis then you can try us absolutely FREE FOR 7 DAYS!
Visit  http://www.ew-forecast.com/service/ for more details

USDCHF 1h
EURUSD also now reversing from our »do or die« level placed at 1.3400, but still need a channel break and impulsive structure (five waves down) from above 1.3400 to make sure we are going lower.
EURUSD 1h
For now we are sitting on our hands, no official trades, but we are watching USDCHF, EURUSD and AUDUSD very closely for possible USD long set-ups. But at the moment however, I think it’s too soon for trades, it’s still only Monday and also holiday in the UK, so I believe it’s better to wait on more price action and see it then if USD rally has already began or no, and then go with the flow.
If you are interested in our analysis then you can try us absolutely FREE FOR 7 DAYS!
Visit  http://www.ew-forecast.com/service/ for more details

Friday, August 23, 2013

GOLD: Sideways Within Larger Uptrend: Elliott Wave Analysis

On Gold we are tracking a bullish continuation from 1272 that should be in five waves, because we are tracking wave C/3 which are both motive waves. Right now we can see only three completed legs, but current sideways price action seems like a fourth wave, so be aware of another rise in the near future, up to 1390-1400 zone.

Only a decisive fall through 1344 support and towards 1318 level will suggest that bearish reversal is unfolding. In such case we would focus on daily alternate count.

GOLD 4h – Elliott Wave Analysis

Wednesday, August 21, 2013

Elliott Wave Analysis: USDJPY Is Showing a Bullish Structure

USDJPY has made three waves of a pull-back from latest high that could be near completion as price tested and already reversed from very important 61.8% Fibonacci support level. We expect to see a move higher from here, ideally in impulsive fashion back to 98.64.
 The reason for a bullish outlook is previous five wave rally in wave A) which is called an impulsive move.  Impulses show direction of a trend or temporary change in trend, that’s why we think that current trend is bullish, and that three wave retracement from 98.65 is temporary. Invalidation level remains at 95.75.
On the basic chart below you can see where USDJPY is at the moment.
 Written by www.ew-forecast.com 

Tuesday, August 20, 2013

OIL: Corrective Pause Appears Complete; 110 Back in View-Elliott Wave Analysis

OIL is trading slightly lower after recent reversal from the upper channel resistance line shown on the 4-hourly chart. However, we cannot ignore a three wave decline from July high which is clearly a contra-trend movement, called a zig-zag in Elliott Wave theory. With that in mind, we will continue to look for higher prices on crude oil as long as 102.15 support is in place. As such, we suspect that current set-back is wave (ii) that may look for a support in 104-105 zone, in one of the Fibonacci support levels. Reversal from there, in impulsive fashion back to 108 will be nice indication for a bullish moves, but then towards 110 level.

OIL 4h chart
On a daily chart of oil we can see that price broke sharply higher few weeks back, which is looking impulsive; its sharp move in the short period of time. Impulses are five wave patterns and if we focus just on latest rally from 91.20 we can see that move is not in five waves yet. As such, we think that latest pull-back from above 109 was wave four so we are looking higher into wave 5.
Oil Daily chart
Written by www.ew-forecast.com | Try ew-forecast.com's services free for 7 days

USD Index: Forming A Complex Correction – Elliott Wave Analysis

USD Index is trading lower for few weeks now but decline from 85.00 has a corrective look for now so we suspect its part of a larger complex correction from May highs. We are tracking a W)-X)-Y) correction, so if we are correct the USD should find a support somewhere around 80.30-81.00 level. An impulsive rally from here and back to 83.00 will put prices back in bullish mode. That's what is called a confirming price action. Let's see if we get one!
If you are interested in our analysis then you can try us absolutely FREE FOR 7 DAYS!

Visit  http://www.ew-forecast.com/service/ for more details

Monday, August 19, 2013

USDJPY Sideways On Daily But Bullish On Intra-day Time Frame

USDJPY found a support last week around 95-96 level as expected from where sharp rally suggests that market accomplished wave C) of a triangle and that price is now moving higher in wave D), still only fourth leg within complex correction. But we need 5 of them, so be aware of more choppy and overlapping price action in 95.80-101.50 range in days ahead before market breaks to the upside. However in the near-term price could reach levels around 99.00 before three wave rise in wave D) is complete. Support for current black sub-wave B comes in around 96.80.

USDJPY Daily-Elliott Wave Analysis Chart
However in the near-term price could reach levels around 99.00 before three wave rise in wave D) is complete. Support for current black sub-wave B comes in around 96.80 where traders with bullish bias could be interested in long opportunities. In that zone we can see a 61.8% retracement area compared to previous five wave rally; that’s an ideal Fibonacci reversal zone for B-waves.
USDJPY 4h-Elliott Wave Analysis Chart
Written by www.ew-forecast.com | Try our services free for 7 days

EURO: Advance since April Low Is Looking Corrective, Be Aware Of A New Sell-off

EURUSD reversed higher few weeks back from around 1.2750 level, but recovery since early April still has a corrective look. With that said, we think that move is complex correction, probably a flat and that larger trend will continue lower, especially if we consider a five wave decline from 1.3700 and the start of the year. If we are correct then current bullish leg should stop somewhere around current 1.3400 -1.3450 resistance area.
On the weekly chart we are also still observing the idea of a Head and Shoulders pattern which if correct, should be near completion based on the parallel trend-lines. This pattern is matching nicely with our Elliott Wave Count, but we still need some confirming price action to make sure that EURUSD is going south. With that said, we would love to see an impulsive fall back to 1.3000 level before bearish reversal can be confirmed! On the other-hand, we will have to change the outlook for the EURUSD if pair will continue higher in the rest of the year, towards 1.3700.

Friday, August 16, 2013

GBPUSD: Three Wave Rally From July Low Suggests A Bearish Reversal

GBPUSD is moving higher, but rally from July low is still in three legs with wave C) now near completion as price is approaching upper trend line of a corrective channel as well as equality level compared to wave A). We can also count five waves up from 1.5100 wave B) low, so sooner or later reversal will follow, ideally from 1.5700.

GBPUSD: Elliott Wave Analysis Chart
Ziag-Zag: Corrective Elliott Wave Pattern
A three wave A-B-C move in Elliott Wave Theory is called a zig-zag that generally moves counter to the larger trend. It is one of the most common corrective Elliott Wave patterns.
• Structure is 5-3-5
• wave A must be a motive wave
• wave B can only be a corrective pattern
• wave B must be shorter than wave A by price distance
• wave C must be a motive wave.
• appears in wave two or four in an impulse, wave B in an A-B-C, wave X in a double or triple zig-zag, or wave Y in a triple threes
Written by www.ew-forecast.com 

Thursday, August 15, 2013

Elliott Wave Analysis: USDCAD Short-term Structure Is Pointing Towards 1.0120-1.0150

USDCAD reversed sharply to the downside at the end of the last week, clearly in impulsive fashion, so structure is now pointing for weaker USDCAD if we consider that rally from 1.0243 was made in three legs, called a correction. We are talking about wave B that has a high in place at 1.0442 from where we expect an impulsive extension down in wave C, back to 1.0243 and possibly even to 1.0150 in this week while 1.0442 is not breached. Recently minor correction has stopped at 1.0350-1.0370 resistance zone from where weakness could resume.
On a daily level we can see that prices have turned bearish maybe just temporary but in either case we need minimum three legs down. Why? Because that’s a minimum structure of a correction, called a zig-zag. So even if larger trend is still up and if current bearish waves are small piece within larger uptrend, the contra-trend movement still needs to be made by three sub-waves.

Wednesday, August 14, 2013

USDJPY Is Trapped In A Triangle Within Larger Uptrend

USDJPY found a support in this week around 95-96 level as expected from where sharp rally suggests that market accomplished wave C) of a triangle and that price is now moving higher in wave D), still only fourth leg within complex correction. But we need 5 of them, so be aware of more choppy and overlapping price action in 95.80-101.50 range in days ahead before market breaks to the upside.
What is a triangle in Elliott Wave Theory? 
A Triangle is a common 5 wave pattern labeled A-B-C-D-E that moves counter-trend and is corrective in nature. Triangles move within two channel lines drawn from waves A to C, and from waves B to D. A Triangle is either contracting or expanding depending on whether the channel lines are converging or expanding. Triangles are overlapping five wave affairs that subdivide 3-3-3-3-3.

• structure is 3-3-3-3-3
• each subwave of a triangle is ussaly a zig-zag
• wave E must end in the price territory of wave A
• one subwave of a triangle usually has a much more complex structure than others subwaves
• appears in wave four in an impulse, wave B in an A-B-C, wave X or wave Y in a double threes, wave X or wave Z in a tripl


Tuesday, August 13, 2013

EURUSD: Bearish Reversal Is Unfolding-Elliott Wave Analysis

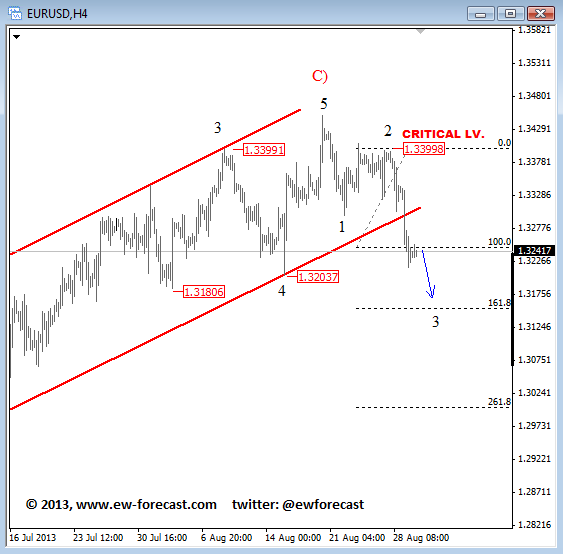
EURUSD has been trading higher last week and reached highs around 1.3400 region from where pair reversed impulsively and suggests that highs are in. As such, larger ending diagonal appears complete and is now pointing for weaker EURUSD. We will be looking for sizable decline once 1.3180 support is taken out. Why 1.3180 support is important? Because that's swing low of wave four, and when floor of wave four is broken this means that trend has changed and that bearish waves are underway.
What is an Ending Diagonal?

An ending diagonal is a special type of pattern that occurs at times when the preceding move has gone too far too fast, as Elliott put it. A very small percentage of ending diagonals appear in the C wave position of A-B- C formations. In double or triple threes, they appear only as the final "C" wave. In all cases, they are found at the termination points of larger patterns, indicating exhaustion of the larger movement.

• structure is 3-3-3-3-3
• a wedge shape within two converging lines
• wave 4 must trade into a territory of a wave 1

• appears primarily in the fifth wave position, in the C wave position of A-B- C and in double or triple threes as the final "C" wave

Monday, August 12, 2013

EURUSD: Elliott Waves and H&S Patterns Are Pointing Lower

EURUSD reversed higher three weeks back from around 1.2750 level, but recovery since early April still has a corrective look. With that said, we think that move is complex correction and that larger trend will continue lower, especially if we consider a five wave decline from 1.3700. If we are correct then current bullish leg should stop somewhere around current 1.3400 -1.3450 resistance area.
 On the weekly time frame we are also observing a huge head and shoulders pattern, now right shoulders at resistance.


Thursday, August 8, 2013

EURUSD: Final Stages within Uptrend-Elliott Wave Analysis

EURUSD has now finally managed to move to a new high for a few pips, which we think it represents wave 5), final leg within ending diagonal in wave C). However, there is room for 1.3410-1.3420 in current leg up but sooner or later we expect a turning point. Bearish divergence on the RSI and and very slow price action supports the idea of approaching top.

Wednesday, August 7, 2013

USDCAD Is Turning Bullish-Elliott Wave Forecast

USDCAD found a support around 1.02560 last week, from where the first reaction appears to be in impulsive fashion through the upper trend-line of a corrective channel. We know that impulses show direction of a trend or change in trend. As such, we are looking higher now, and it’s also because of a previous three wave decline from above 1.0600 which was a corrective move, so larger trend remains up and is now in continuation mode. Current wave 2/B could be looking for a support around 1.0300-1.0330. Invalidation point for bullish outlook is at 1.0243.
If you are interested in our analysis then you can try us absolutely FREE FOR 7 DAYS!

Visit  http://www.ew-forecast.com/service/ for more details.


Tuesday, August 6, 2013

S&P500 Could Touch 1750 or Even 1800 Till The End Of The Summer

S&P500 reversed sharply to the upside from 1550 support, clearly in impulsive fashion. As such, we labeled end of a corrective blue wave (4) at latest swing low from where we are now tracking a new bullish leg on stocks, this time towards 1750 or possibly even to 1800 region in coming weeks for fifth wave in III.
If you are interested in our analysis then you can try us absolutely FREE FOR 7 DAYS!

Visit  http://www.ew-forecast.com/service/ for more details
However, we must also be aware that wave five is final leg within impulsive rally so no question, corrective reversal will occur but at the moment we don’t see it unfolding yet. On the basic chart below you can see where we think US stock market is at the moment.

If you are interested in our analysis then you can try us absolutely FREE FOR 7 DAYS!
Visit  http://www.ew-forecast.com/service/ for more details. 

Monday, August 5, 2013

AUDUSD: Corrective Rally Could Be A Short Opportunity

AUD has been one of the weakest currencies in the last two weeks after pair reversed down from around 0.9300 region which has been expected because of a corrective price action since start of July. We are talking about blue wave (4) that was an expanded flat. If that’s the case then pair is now in wave (5) that needs to be made by five sub-waves, so more weakness is in view if we consider that price is now at the end of a red wave 3) that will be looking for a temporary support around 0.8850 (261.8% Fibonacci extension of wave two). In the next few days price could recover, but only in corrective fashion back to 0.9000 which could be a nice are for shorts.

If you are interested in our analysis then you can try us absolutely FREE FOR 7 DAYS!
Visit  http://www.ew-forecast.com/service/ for more details